NikeFuel Weather Activity
Back in 2013, we connected daily NikeFuel to localized weather data to see how temperature, rain, and snow impacted physical activity patterns around the U.S.
Play with the interactive map below to see how movement changes when the weather rolls in.
w Scroll Down
United Statesb2.8%
The average daily NikeFuel for the U.S. is 3201+. When the temperature is between 60-70, NikeFuel maintains its averageaverage NikeFuel is up 2.8% (3290+).
iAbout this map
TEMPERATURE
60-70°
Tap arrows to change temperature.
Getting Cold Feet
Across the country, the U.S. is least active when it’s below freezing, earning on average 6.5% less NikeFuel a day (2993+)
mRead more
pBelow 30°
From coast to coast, activity is most negatively affected by freezing temperatures. California, Vermont, and Minnesota handle sub-30° temperatures better than the rest of the country, yet they’re still performing below their daily overall average.
North vs. South
With colder temperatures, the U.S. performs 4.6% below average, earning 3053+ NikeFuel a day
mRead more
p30-40°
At temperatures just above freezing, the Midwest and New England begin waking up; they fare better in the cold than the typically warmer South. In the 30s southern Gulf States earn 6.7% less NikeFuel than the U.S. daily average.
It’s time for a warm-up
At 3135+, or 2.1% below average daily NikeFuel, the U.S. waits for warmer temperatures before reaching normal activity levels
mRead more
p40-50°
The 40s are warm enough for New England to get moving, while in the Southwest it still feels like winter. California, Nevada, and Arizona earn 4.1% below their regional daily average NikeFuel.
Heating up
The U.S. comes out of hibernation, earning just above average daily NikeFuel (3229+)
mRead more
p50-60°
At 50° the Northern Rockies and Plains are on the move, earning 5.2% above their regional average. Still not convinced of the warmth, southern states lie low in the 50s, hovering just around average daily NikeFuel.
Peak Activity
The U.S. averages the most NikeFuel from 60–70°, reaching peak performance at 66° (3304+)
mRead more
p60-70°
After a harsh winter, the Midwest gets the most active in the 60s. In the more temperate south, states hover just above average NikeFuel.
Some Like it Hot
When it’s warm the U.S. amps up its average NikeFuel by 2.0% (3264+)
mRead more
p70-80°
The Pacific Northwest and the Dakotas perform especially well in warm temperatures, while New England’s Vermont, New Hampshire, and Rhode Island begin to fall from peak activity.
East Side vs. West Side
The U.S. hovers just above average daily NikeFuel when it’s over 80°, at 3218+, and more than half of states dip below peak activity
mRead more
pAbove 80°
Western Rocky Mountain states turn up their intensity in the heat, earning 6.5% more than their regional average NikeFuel per day. On the East Coast, NikeFuel hovers just around average.
Rain or Shine
The U.S. maintains average NikeFuel on rainy days (3201+)
mRead more
" RAIN
The dry Southwest struggles to get moving in the rain, while states in the Northern Rockies and Plains power through.
Snowed In
The U.S. earns 5.3% less NikeFuel on days when it snows (3032+)
mRead more
; SNOW
While the South slows down the most, even typical ski states earn below-average NikeFuel on days when it snows.
username
Log out
iAbout this chart
Your Weather Stats
Movement
Temperature
Best Day
oWorkouts
weekly
total
hHours Won
daily
total
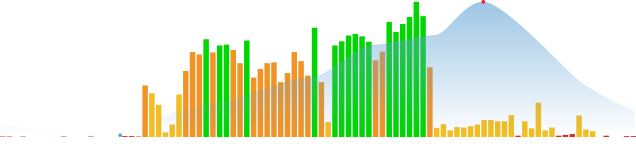
Workout Sweet Spot
You average the most weekly workouts between 30-40°, that’s 10% more than your overall weekly average. Interact with the chart to see how weather affects your activity. Temperature ranges with fewer hours may magnify spikes and dips in the chart.
Activity
High 3h 34m
Medium 6h 21m
Low 12h 4m
Inactive 15h 55m
Most Active Temperature
Your optimal temperature range for activity is between 30-40°. At this range your average daily NikeFuel is +, or 10% higher than your regular average at +.
Interact with the chart to see how temperature affects your activity. Temperature ranges with fewer hours may magnify spikes and dips in the chart.
Best Day +
Your most active day in 2013 was , when you earned + NikeFuel. That’s an increase of % compared to your daily average NikeFuel of +.
Was your best day outside of Portland, OR? Change the location at the upper right. Interact with the chart above to see how the weather affects your level of activity.
How does the weather move you?
See how temperature and precipitation impacted physical activity patterns for select individuals.
Move more, in any condition
Now that you have a better understanding of how changes in weather impact your physical activity patterns, get moving this summer with the following Nike+ products and services:
NIKE+ Ecosystem
Use your Nike+ Running App, Nike+ Training Club App, or the Nike+ FuelBand to move more this summer.
GET moving with us
Search for upcoming Nike+ Training Classes and Nike Run Clubs near you.
2013 Year in NikeFuel
See how Nike+ Fuelband users move, you might be inspired to change your routine.
Just do it forums
We’re better together. Join our community of athletes to inspire, educate, and achieve our goals together.
Terms of Use Support FAQs Privacy © 2014 Nike, Inc. All Rights Reserved